Descriptive Statistics in Excel
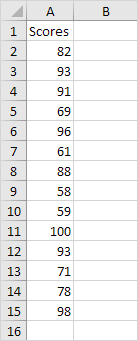
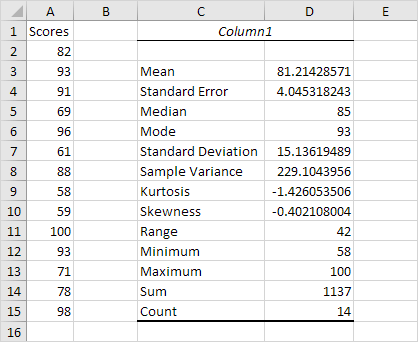
You can use the Analysis Toolpak add-in to generate descriptive statistics. For example you may have the scores of 14 participants for a test.
To generate descriptive statistics for these scores execute the following steps.
1. On the Data tab in the Analysis group click Data Analysis.
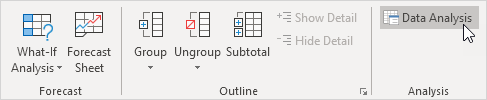
Note: can't find the Data Analysis button? Click here to load the Analysis ToolPak add-in.
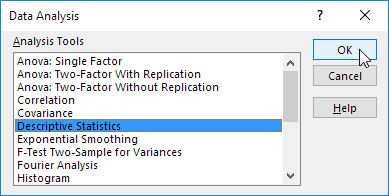
2. Select Descriptive Statistics and click OK.
3. Select the range A2:A15 as the Input Range.
4. Select cell C1 as the Output Range.
5. Make sure Summary statistics is checked.
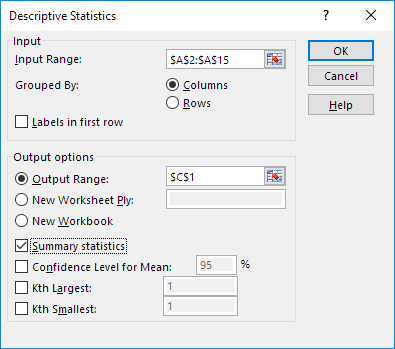
6. Click OK.
Result:
Tip: visit our page about statistical functions to learn more about this topic.
Written by
Jason Howie
Founder, FormulasHQ
A formula nerd with a passion for numbers and equations. Writes about Excel, Google Sheets, VBA, regex, and Salesforce formulas — for people who spend their day in spreadsheets.