How to use ExcelOctober 10, 2024
Create a Bar Chart in Excel
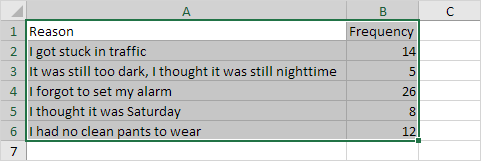
A bar chart is the horizontal version of a column chart. Use a bar chart if you have large text labels.
To create a bar chart execute the following steps.
1. Select the range A1:B6.
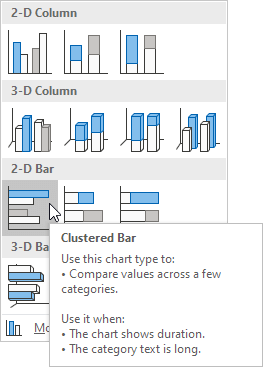
2. On the Insert tab in the Charts group click the Column symbol.

3. Click Clustered Bar.
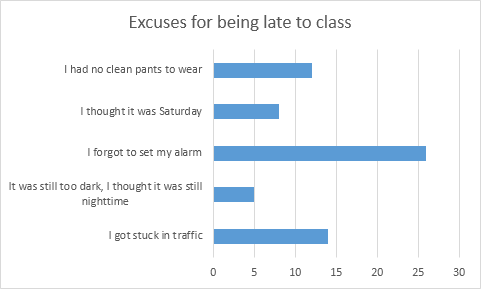
Result:
Written by
Jason Howie
Founder, FormulasHQ
A formula nerd with a passion for numbers and equations. Writes about Excel, Google Sheets, VBA, regex, and Salesforce formulas — for people who spend their day in spreadsheets.