How to use ExcelOctober 8, 2024
Combination Chart in Excel
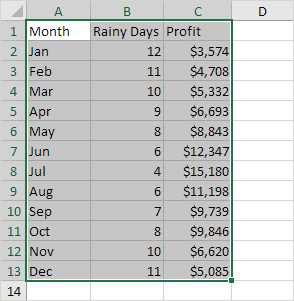
A combination chart is a chart that combines two or more chart types in a single chart.
To create a combination chart execute the following steps.
1. Select the range A1:C13.
2. On the Insert tab in the Charts group click the Combo symbol.
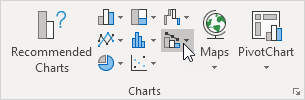
3. Click Create Custom Combo Chart.

The Insert Chart dialog box appears.
4. For the Rainy Days series choose Clustered Column as the chart type.
5. For the Profit series choose Line as the chart type.
6. Plot the Profit series on the secondary axis.
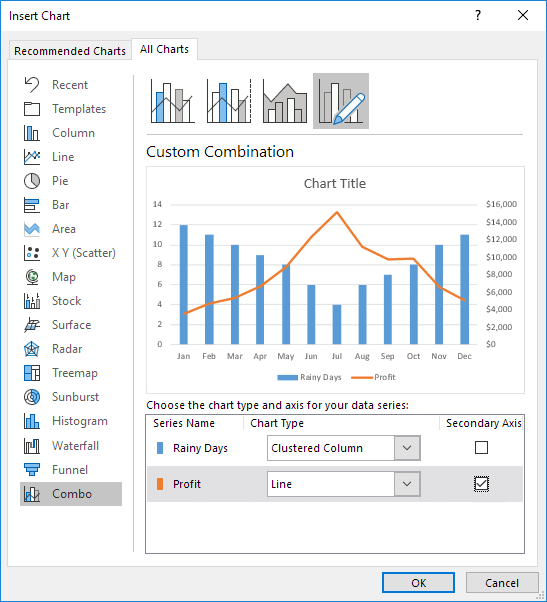
7. Click OK.
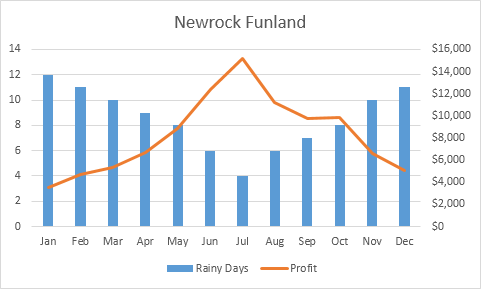
Result:
Written by
Jason Howie
Founder, FormulasHQ
A formula nerd with a passion for numbers and equations. Writes about Excel, Google Sheets, VBA, regex, and Salesforce formulas — for people who spend their day in spreadsheets.