Table as Source Data - Excel Tutorial
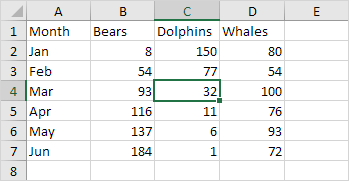
One of the great things about tables in Excel is that you can use a table as source data for a chart pivot table etc.
To see why this is useful let's create a simple chart.
1. Select a cell in the source data.
2. Press Ctrl + T to quickly insert a table.
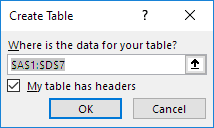
3. Press Enter.
Result so far:

4. On the Insert tab in the Charts group click the Column symbol.
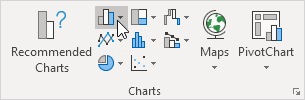
5. Click Clustered Column.

Result:
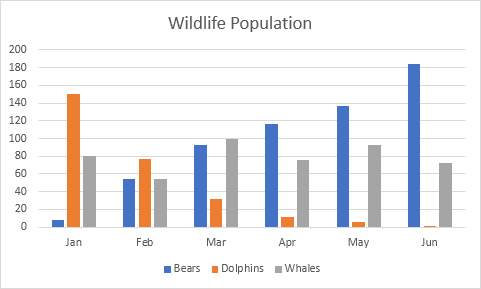
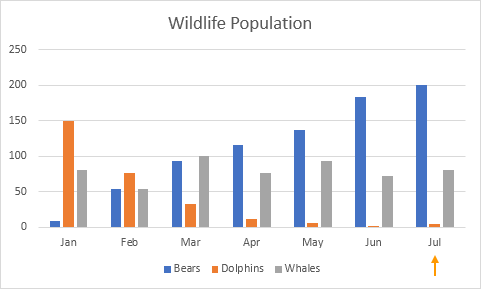
Now comes the most important part. New rows or columns added to the table will automatically be included in the chart.
6. Select cell A8 and type Jul (Excel automatically formats this new row for you).
7. Enter the data for this month.

Excel automatically updates this dynamic chart. That's pretty awesome.
Note: as mentioned earlier you can also use a table to create a dynamic pivot table or even better use a table and the new UNIQUE function in Excel 365/2021 to create a magic drop-down list.
Written by
Jason Howie
Founder, FormulasHQ
A formula nerd with a passion for numbers and equations. Writes about Excel, Google Sheets, VBA, regex, and Salesforce formulas — for people who spend their day in spreadsheets.