Table of Contents
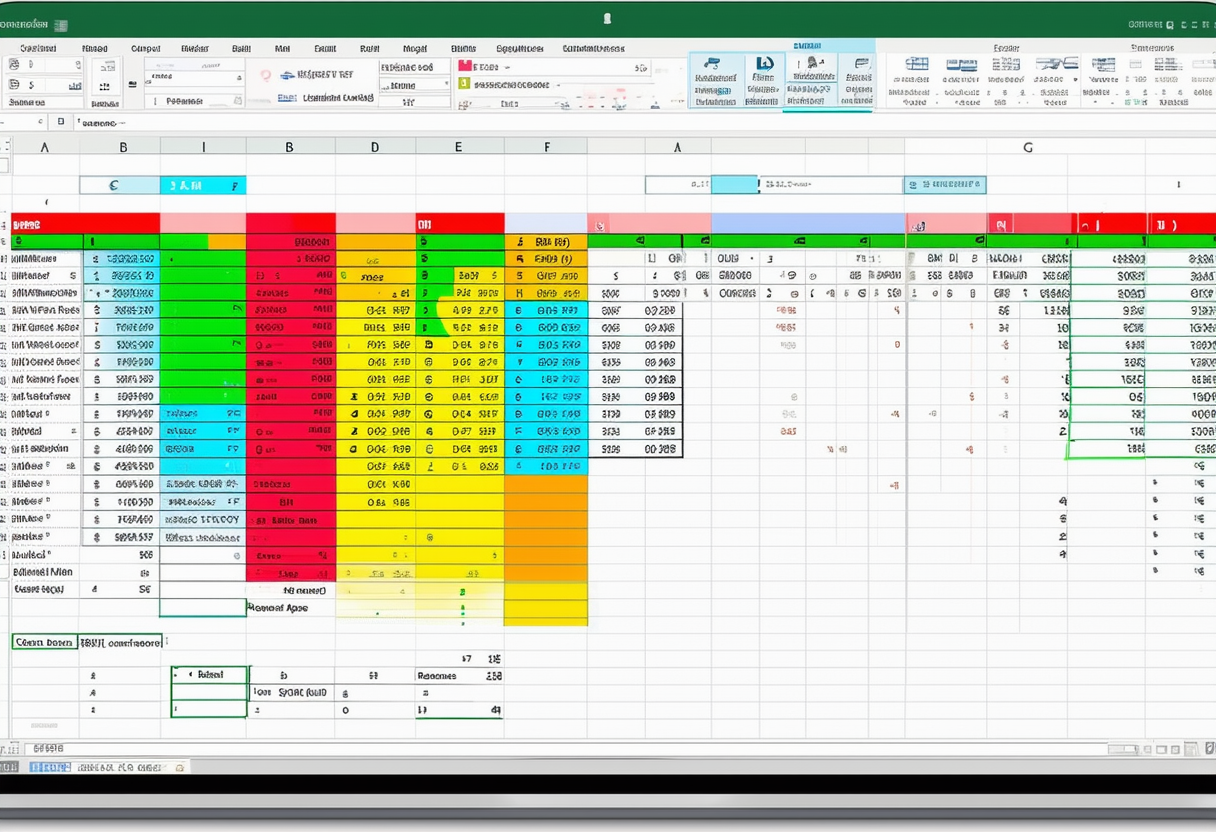
Excel is a powerful tool that allows users to analyze and manipulate data in various ways. One common task is comparing two columns of data to identify similarities, differences, or patterns. In this article, we will explore the essential formulas and techniques you can use to compare two columns in Excel effectively. By the end of this article, you will have a solid understanding of how to approach column comparison in Excel and be equipped with the necessary tools to make data analysis a breeze.
Understanding the Basics of Excel Columns
Before we dive into the specifics of comparing two columns in Excel, let’s first define what exactly we mean by “Excel columns.” In Excel, a column is a vertical arrangement of cells, identified by letters (A, B, C, etc.) at the top of each column. Columns are used to organize and store data in a tabular format, making it easier to work with and analyze large sets of information. Understanding how columns work in Excel is crucial to effectively comparing data.
Defining Excel Columns
In Excel, columns are numbered from left to right, starting with column A. Each column can accommodate up to 1,048,576 cells, making Excel a versatile tool for handling massive amounts of data. Columns can be resized, hidden, or manipulated to better fit your data analysis needs. Being able to identify and interact with columns appropriately is essential when comparing data in Excel.
Importance of Column Comparison in Excel
Now that we have a good grasp of what columns are in Excel, let’s discuss why comparing columns is important. Column comparison allows us to identify similarities and differences between datasets, making it easier to spot trends, outliers, or inconsistencies. Whether you are working with sales data, survey results, or financial figures, being able to compare columns provides valuable insights that can inform decision-making and drive business success.
Preparing Your Excel Sheet for Column Comparison
Before we can compare two columns in Excel, it is crucial to organize and clean up your data. Messy or unstructured data can lead to inaccuracies and make the comparison process more challenging. Here are some steps to follow when preparing your Excel sheet for column comparison:
Organizing Data in Excel
In order to effectively compare columns, it is important to have your data structured in a logical and consistent manner. This may involve arranging your data into separate columns, ensuring consistent data types, and sorting the data if necessary. By organizing your data beforehand, you can make the comparison process much smoother and more accurate.
Cleaning Up Your Data
Another crucial step in preparing your Excel sheet for column comparison is cleaning up your data. This involves removing any duplicates, correcting errors, and ensuring data consistency. Cleaning up your data helps eliminate potential discrepancies and ensures that your comparison results are reliable and accurate.
Introduction to Essential Excel Formulas
Excel formulas are the building blocks of powerful data analysis in Excel. To compare two columns effectively, it is essential to have a good understanding of the formulas at your disposal. Let’s take a quick look at some of the essential Excel formulas commonly used in column comparison:
Overview of Excel Formulas
Excel offers a wide range of formulas to perform various calculations and operations on your data. From basic arithmetic functions to complex statistical analysis, Excel has a formula for almost any data manipulation task. Understanding the different types of formulas available to you will greatly enhance your ability to compare columns accurately and efficiently.
Understanding Excel Syntax
Excel formulas are written using a specific syntax that must be followed for them to work correctly. The syntax includes functions, operators, and references to cells or ranges. Understanding the syntax of Excel formulas is essential for building complex formulas and troubleshooting any issues that may arise during your column comparison process.
Using the ‘IF’ Function for Column Comparison
The ‘IF’ function is a versatile formula that allows you to perform conditional comparisons between two values. When comparing two columns in Excel, the ‘IF’ function can be particularly useful in identifying similarities or differences between corresponding cells. Let’s take a closer look at how the ‘IF’ function works and how it can be applied to compare columns:
How the ‘IF’ Function Works
The ‘IF’ function in Excel evaluates a specified condition and returns one value if the condition is true and another value if the condition is false. By using logical comparisons within the ‘IF’ function, you can compare two columns and return specific results based on the outcome of the comparison. Understanding how the ‘IF’ function works is key to leveraging its power for column comparison.
Applying the ‘IF’ Function for Comparison
When using the ‘IF’ function for column comparison, you can define the condition based on specific criteria or rules. For example, you can compare two columns and return “Yes” if the corresponding values match and “No” if they don’t. By applying the ‘IF’ function iteratively across your data set, you can quickly identify patterns, differences, or inconsistencies between columns.
Utilizing the ‘VLOOKUP’ Function for Column Comparison
Another essential formula for comparing two columns in Excel is the ‘VLOOKUP’ function. The ‘VLOOKUP’ function allows you to search for a specific value in one column and retrieve information from another column in the same row. This can be exceptionally useful when comparing columns with related data sets. Let’s explore the ‘VLOOKUP’ function and how it can be utilized for column comparison:
Understanding the ‘VLOOKUP’ Function
The ‘VLOOKUP’ function searches for a value in the first column of a table array and returns a corresponding value from another column in the same row. By specifying the appropriate table array, column index, and range lookup options, you can use the ‘VLOOKUP’ function to compare two columns and extract relevant information for further analysis.
Implementing the ‘VLOOKUP’ Function for Comparison
To compare two columns using the ‘VLOOKUP’ function, you need to have a common key or identifier that exists in both columns. By specifying this key as the lookup value, you can retrieve matching information from another column. With the flexibility and power of the ‘VLOOKUP’ function, you can perform advanced column comparisons and gain valuable insights from your data.
By understanding the basics of Excel columns, organizing and cleaning up your data, and utilizing essential formulas like the ‘IF’ and ‘VLOOKUP’ functions, you are well-equipped to compare two columns effectively and efficiently. Excel provides a wealth of tools and functionalities to analyze and manipulate data, and mastering column comparison is just one step in becoming proficient in this powerful software.
Coordinating with Sales Post Conference: 5 Essential Ways
Coordinating with sales after a conference is crucial to maximize the return on investment for your B2B events. It is not enough to simply attend a conference; it is essential to follow up and nurture leads to ensure business growth. Here are five essential ways to coordinate with sales post conference:
- Send Personalized Follow-up Emails: Following a conference, it is important to send personalized follow-up emails to the contacts you made. Mention specific conversations or topics discussed during the conference to demonstrate that you valued their time and attention.
- Schedule Follow-up Calls or Meetings: Take your coordination to the next level by scheduling follow-up calls or meetings with the leads you identified at the conference. This allows for more in-depth discussions and provides an opportunity to explore potential business opportunities.
- Share Conference Highlights: Keep the excitement and momentum going by sharing highlights from the conference with your sales team. Provide them with key insights, trends, or learnings that can be leveraged in future client interactions.
- Provide Sales Enablement Materials: Support your sales team by equipping them with relevant sales enablement materials, such as case studies, product brochures, or demo videos. These resources can help them address customer pain points and showcase the value of your offerings.
- Track and Measure Results: Finally, it is essential to track and measure the results of your post-conference coordination efforts. Use CRM systems or sales tracking tools to monitor lead conversion rates, deal closures, and overall ROI. This data can guide future conference participation and improve your sales strategies.
Coordinated follow-up after a conference is paramount to successful B2B events. By implementing these essential ways of coordinating with sales, you can nurture leads, build relationships, and ultimately drive business growth and success.
