Table of Contents
Moving Average
This example teaches you how to calculate the moving average of a time series in Excel. A moving average is used to smooth out irregularities (peaks and valleys) to easily recognize trends.
1. First let’s take a look at our time series.
2. On the Data tab in the Analysis group click Data Analysis.
Note: can’t find the Data Analysis button? Click here to load the Analysis ToolPak add-in.
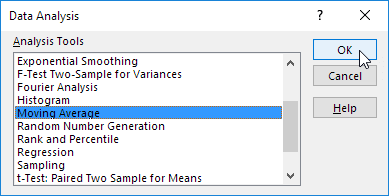
3. Select Moving Average and click OK.
4. Click in the Input Range box and select the range B2:M2.
5. Click in the Interval box and type 6.
6. Click in the Output Range box and select cell B3.
7. Click OK.
8. Plot a graph of these values.
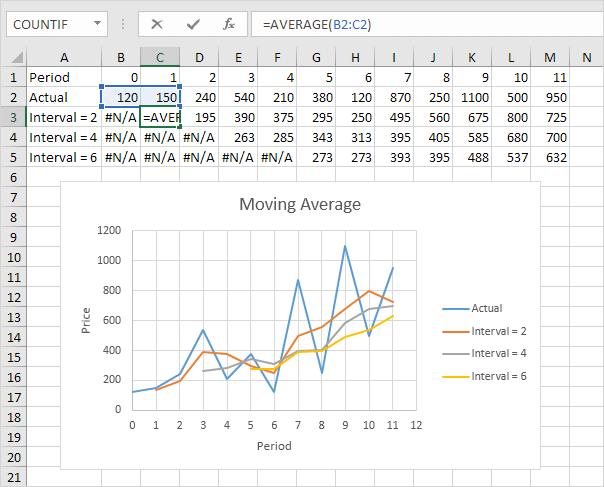
Explanation: because we set the interval to 6 the moving average is the average of the previous 5 data points and the current data point. As a result peaks and valleys are smoothed out. The graph shows an increasing trend. Excel cannot calculate the moving average for the first 5 data points because there are not enough previous data points.
9. Repeat steps 2 to 8 for interval = 2 and interval = 4.
Conclusion: The larger the interval the more the peaks and valleys are smoothed out. The smaller the interval the closer the moving averages are to the actual data points.


