Table of Contents
Error Bars
This page teaches you how to quickly add error bars to a chart in Excel, followed by instructions for adding custom error bars.
Add Error Bars
To quickly add error bars, execute the following steps:
1. Select the chart.
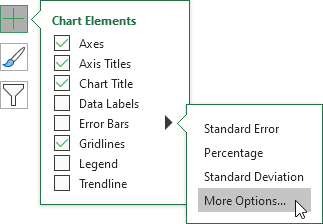
2. Click the + button on the right side of the chart, click the arrow next to Error Bars, and then click More Options.
Notice the shortcuts to add error bars using the Standard Error, a percentage value of 5%, or 1 standard deviation.
The Format Error Bars pane appears.
3. Choose a Direction. Click Both.
4. Choose an End Style. Click Cap.
5. For example, click Fixed value and enter the value 10.
6. If you add error bars to a scatter plot, Excel also adds horizontal error bars. To remove the horizontal error bars, select them and press Delete.
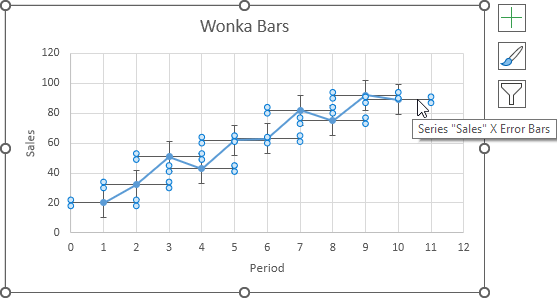
Result:
Explanation: The vertical error bar in period 1 (value of 20) indicates a range of 10 to 30 Wonka bars sold. The vertical error bar in period 2 (value of 32) indicates a range of 22 to 42 Wonka bars sold, and so on.
Custom Error Bars
To add awesome custom error bars, execute the following steps:
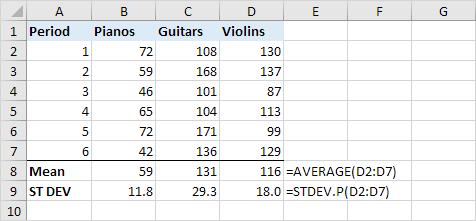
1. Below you can find our data.
Note: We used the AVERAGE function to calculate the means and the STDEV.P function to calculate the standard deviations. Visit our page about standard deviation to learn more about this topic.
2. Select the range A1:D1, hold down CTRL, and select the range A8:D8 (means).
3. Insert a column chart.
Result:
4. Select the chart.
5. Click the + button on the right side of the chart, click the arrow next to Error Bars, and then click More Options.
The Format Error Bars pane appears.
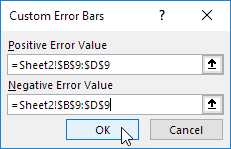
6. Select Custom and click the Specify Value button.
7. Empty the Positive Error Value box and select the range B9:D9 (standard deviations). Repeat this step for the Negative Error Value box.
8. Click OK.
Result:
Explanation: The error bars have different lengths, and each length represents a different standard deviation for its mean. To change the color of error bars, click the paint bucket icon under ‘Error Bar Options’ (see step 6).
