Table of Contents
Outlining Data
Outlining data makes your data easier to view. In this example we will total rows of related data and collapse a group of columns.
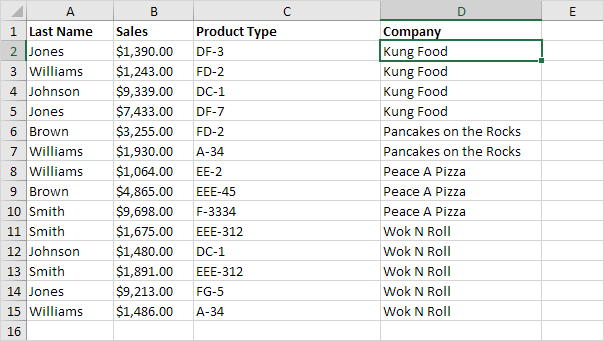
1. First sort the data on the Company column.
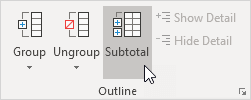
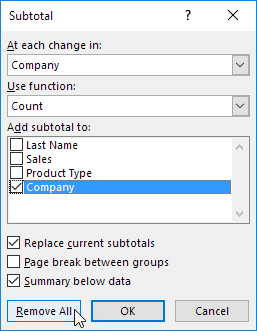
2. On the Data tab in the Outline group click Subtotal.
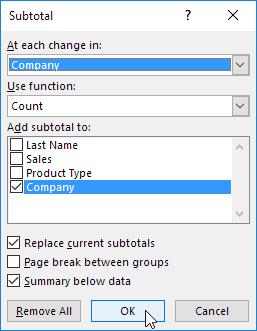
3. Select the Company column the column we use to outline our worksheet.
4. Use the Count function.
5. Check the Company check box.
6. Click OK.
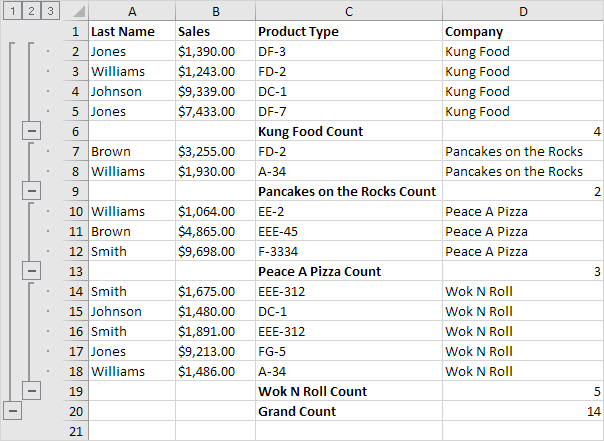
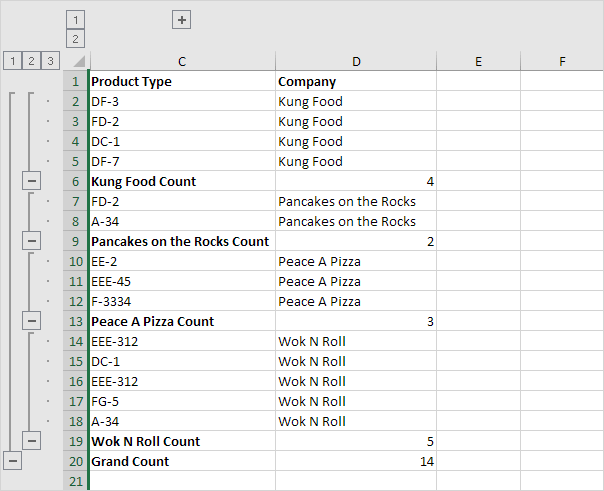
Result:
7. To collapse a group of cells click a minus sign. You can use the numbers to collapse or expand groups by level. For example click the 2 to only show the subtotals.
Note: click the 1 to only show the Grand Count click the 3 to show everything.
To collapse a group of columns execute the following steps.
8. For example select column A and B.
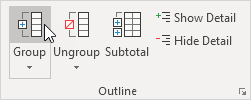
9. On the Data tab in the Outline group click Group.
10. Click the minus sign above column C (it will change to a plus sign).
Result:
11. To remove the outline click any cell inside the data set and on the Data tab in the Outline group click Subtotal Remove all.
