Table of Contents
Excel is a powerful tool that is widely used for data analysis and visualization. It allows users to create organized and visually appealing dashboards to present data in a more understandable and insightful way. In this article, we will explore the world of Excel dashboard templates, understand their importance, learn how to access them, discover different types of templates available, and even learn how to create your own. So, let’s dive in!
Understanding Excel Dashboard Templates
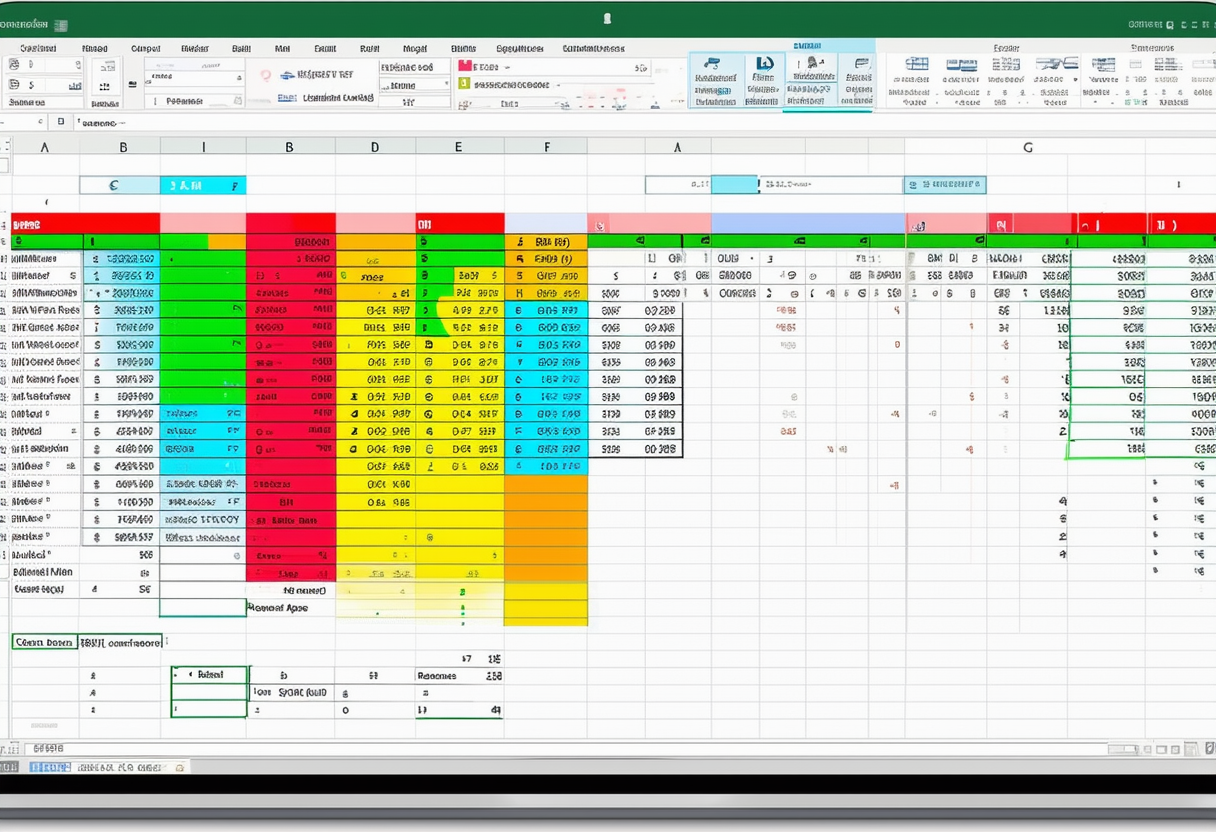
Excel dashboard templates refer to pre-designed worksheets or workbooks that provide a structure and layout for organizing and displaying data in a dashboard format. These templates consist of various elements such as charts, tables, graphs, and other visual elements that facilitate data analysis and interpretation. They are designed to make data presentation more visually appealing, meaningful, and easy to understand.
Creating an Excel dashboard from scratch can be a time-consuming task, requiring advanced knowledge of Excel functions and design principles. This is where dashboard templates come in handy, as they offer a ready-made solution for users looking to streamline the process of creating informative and visually appealing dashboards.
Definition of Excel Dashboard Templates
Excel dashboard templates are a collection of preformatted worksheets or workbooks that offer a framework for creating dashboards in Excel. They typically include predefined layouts, formulas, and formatting options that make it easier for users to create visually striking and effective dashboards.
These templates often come with built-in functionalities such as interactive elements, conditional formatting, and data visualization tools that enhance the overall user experience. By leveraging these pre-built features, users can focus more on analyzing their data and deriving valuable insights, rather than spending time on manual formatting and design.
Importance of Excel Dashboard Templates
Excel dashboard templates play a crucial role in data analysis and decision-making processes. They provide a streamlined approach to organizing and presenting data, helping users quickly identify patterns, trends, and insights. With the help of these templates, users can present complex data in a simplified manner, enabling stakeholders and decision-makers to make informed choices.
Furthermore, Excel dashboard templates can be customized to suit specific business needs and reporting requirements. Users have the flexibility to adjust the layout, color scheme, and data sources to align with their unique preferences and objectives. This adaptability ensures that the dashboards generated from these templates are not only visually appealing but also tailored to deliver relevant and actionable information.
Steps to Access Excel Dashboard Templates
To access Excel dashboard templates, follow these steps:
Opening Excel Dashboard Templates
1. Open Microsoft Excel on your computer.
2. Click on the “File” tab in the menu bar.
3. Select “New” from the drop-down menu.
4. In the search bar, type “dashboard templates.”
5. Hit Enter or click on the search icon.
6. Browse through the available templates and select the one that fits your needs.
7. Click on the template to open it.
8. Customize the template by adding your own data and modifying the layout as required.
Customizing Excel Dashboard Templates
Once you have opened an Excel dashboard template, you can customize it according to your specific requirements:
1. Add or remove charts, tables, and graphs to represent your data.
2. Modify the formatting, color scheme, and font styles to align with your organization’s branding or personal preferences.
3. Adjust the data ranges and formulas to reflect your dataset accurately.
4. Incorporate additional features, such as conditional formatting or interactive elements, to enhance the functionality of your dashboard.
Expanding on the customization process, it’s essential to consider the audience for your Excel dashboard. Are you creating it for executives who need a high-level overview, or for analysts who require detailed data analysis? Tailoring the dashboard to meet the specific needs of its users will ensure its effectiveness and usability. Additionally, think about the key performance indicators (KPIs) that are most important to track for your project or business. By prominently featuring these KPIs on the dashboard, you can quickly convey critical information at a glance.Furthermore, when customizing Excel dashboard templates, don’t overlook the importance of data visualization best practices. Utilize appropriate chart types for different data sets, ensure that labels are clear and concise, and avoid cluttering the dashboard with unnecessary information. Effective data visualization not only makes the dashboard aesthetically pleasing but also aids in conveying information accurately and efficiently. Remember, the goal of an Excel dashboard is to present complex data in a clear and understandable way, so take the time to design it thoughtfully.
Types of Excel Dashboard Templates
Excel offers a wide range of dashboard templates catering to various industries and purposes. Let’s explore some popular types:
Project Management Dashboard Templates
These templates are ideal for overseeing project progress, monitoring performance metrics, and tracking key milestones. They often include project timelines, resource allocation charts, and task completion trackers.
Project management dashboard templates can also incorporate features like risk assessment matrices, Gantt charts for visual project scheduling, and project status reports. These templates help project managers streamline communication, identify bottlenecks, and make data-driven decisions to ensure successful project completion.
Sales Dashboard Templates
These templates focus on monitoring sales performance, analyzing revenue streams, and tracking sales targets. They typically include charts and graphs to visualize sales data, customer insights, and market trends.
In addition to the standard sales metrics, some sales dashboard templates may include lead conversion rates, customer acquisition costs, and sales pipeline analyses. By providing a comprehensive view of sales activities, these templates empower sales teams to identify opportunities for growth, optimize strategies, and improve overall performance.
Financial Dashboard Templates
These templates are designed to provide an overview of an organization’s financial health and performance. They may include balance sheets, income statements, cash flow analyses, and relevant financial ratios.
Financial dashboard templates can also feature budget variance analysis, forecasting models, and trend analysis tools. By consolidating financial data into easy-to-understand visuals, these templates assist finance professionals in making informed decisions, identifying areas for cost savings, and ensuring long-term financial stability.
Creating Your Own Excel Dashboard Template
While pre-designed dashboard templates are readily available, creating your own can offer more customization and tailor the dashboard to your specific needs. Here are the steps to create your own Excel dashboard template:
Planning Your Dashboard
1. Determine the purpose and objective of your dashboard.
2. Identify the key metrics and data points you want to include.
3. Sketch a rough layout or wireframe of your dashboard to visualize its structure and components.
Designing Your Dashboard
1. Create a new workbook in Excel.
2. Divide your dashboard into sections and allocate space for different charts, tables, and graphs.
3. Import or enter your data into the appropriate cells.
4. Choose suitable chart types and create visually appealing visualizations to represent your data.
Implementing Your Dashboard
1. Apply formatting options to enhance the aesthetics and readability of your dashboard.
2. Add interactive elements like drop-down menus or slicers to enable easy data filtering.
3. Test your dashboard by entering different data values to ensure its accuracy and functionality.
Tips for Using Excel Dashboard Templates
While working with Excel dashboard templates, keep the following tips in mind:
Keeping Your Dashboard Simple
Focus on the key metrics and relevant data points. Avoid cluttering your dashboard with unnecessary information that may distract or confuse users.
Regularly Updating Your Dashboard
Keep your dashboard up-to-date by regularly updating the data it represents. This ensures that your dashboard provides real-time insights and accurate information for decision-making.
Making Your Dashboard Visually Appealing
Use color schemes, fonts, and visual elements that are visually appealing and align with your organization’s branding. Employ appropriate data visualization techniques to convey information effectively.
Now that you have a better understanding of Excel dashboard templates, their importance, and how to access and create them, you can harness the power of Excel to create visually stunning and impactful dashboards for your data analysis and reporting needs. So, dive into the world of Excel dashboards and unlock new insights from your data!
