Table of Contents
Microsoft Excel, a powerful spreadsheet software developed by Microsoft, is a tool that offers numerous functionalities to its users. One of the most useful features it provides is conditional formatting. This feature allows users to change the formatting of cells, rows, and columns based on the values they contain. This guide will delve into the depths of conditional formatting in Microsoft Excel, explaining the various formulas that can be used to manipulate and enhance your data.
Understanding conditional formatting and its associated formulas can significantly improve your efficiency when working with Excel. It allows you to highlight specific data points, identify trends, and make your spreadsheets more visually appealing and understandable. Whether you’re a beginner just starting out with Excel or an experienced user looking to expand your knowledge, this guide will provide a comprehensive overview of conditional formatting and its associated formulas.
Understanding Conditional Formatting
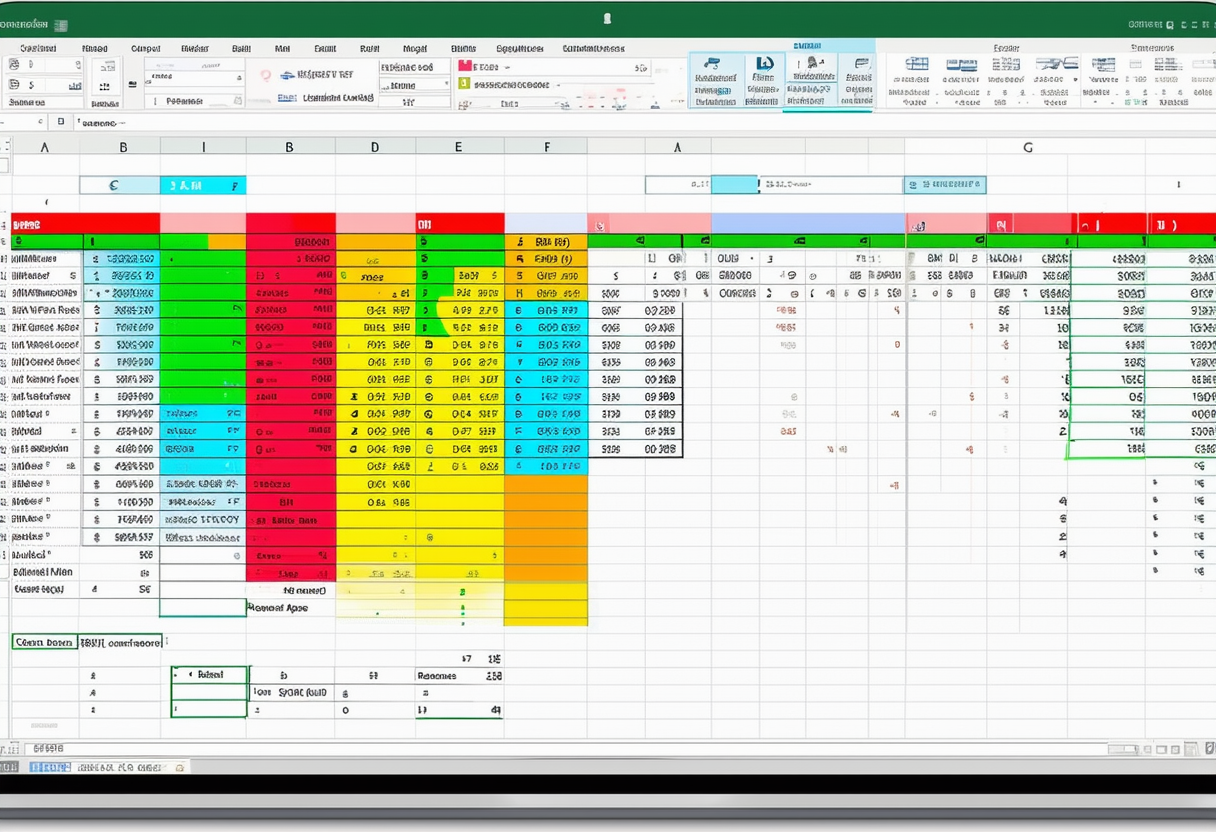
Before we delve into the formulas associated with conditional formatting, it’s important to understand what conditional formatting is and how it works. Conditional formatting is a feature in Excel that allows you to change the appearance of cells based on their contents. This means you can automatically highlight cells that meet certain criteria, making it easier to analyze large amounts of data.
For example, you might use conditional formatting to highlight cells that contain values above a certain threshold, or to color-code cells based on their values. This can be incredibly useful when working with large datasets, as it allows you to quickly and easily identify trends and anomalies.
Applying Conditional Formatting
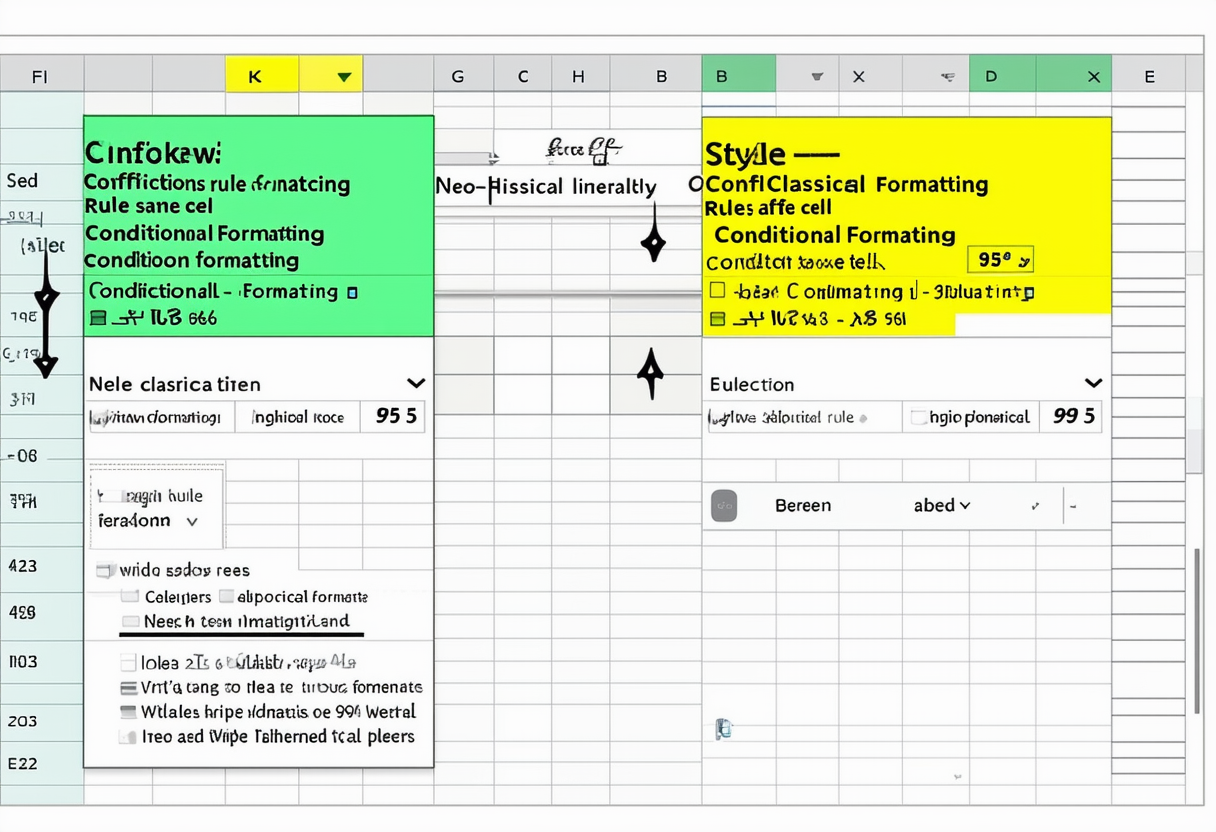
To apply conditional formatting in Excel, you first need to select the cells you want to format. Then, you can choose from a variety of preset formatting rules, or create your own custom rules using formulas. The process of applying conditional formatting can be broken down into three steps: selecting cells, choosing a rule, and defining the formatting.
When selecting cells, you can choose individual cells, entire rows or columns, or a range of cells. Once you’ve selected the cells, you can choose a rule. Excel provides a variety of preset rules, such as highlighting cells that contain certain values, or formatting cells that are above or below average. If these preset rules don’t meet your needs, you can create your own custom rules using formulas.
Removing Conditional Formatting
Just as you can apply conditional formatting, you can also remove it. This can be done by selecting the cells with the formatting you want to remove, and then choosing the “Clear Rules” option from the conditional formatting menu. This will remove all conditional formatting rules from the selected cells.
It’s important to note that removing conditional formatting will not affect the actual data in the cells – it will only remove the formatting. This means that your data will remain intact, but it will no longer be highlighted or color-coded based on its values.
Understanding Formulas in Conditional Formatting
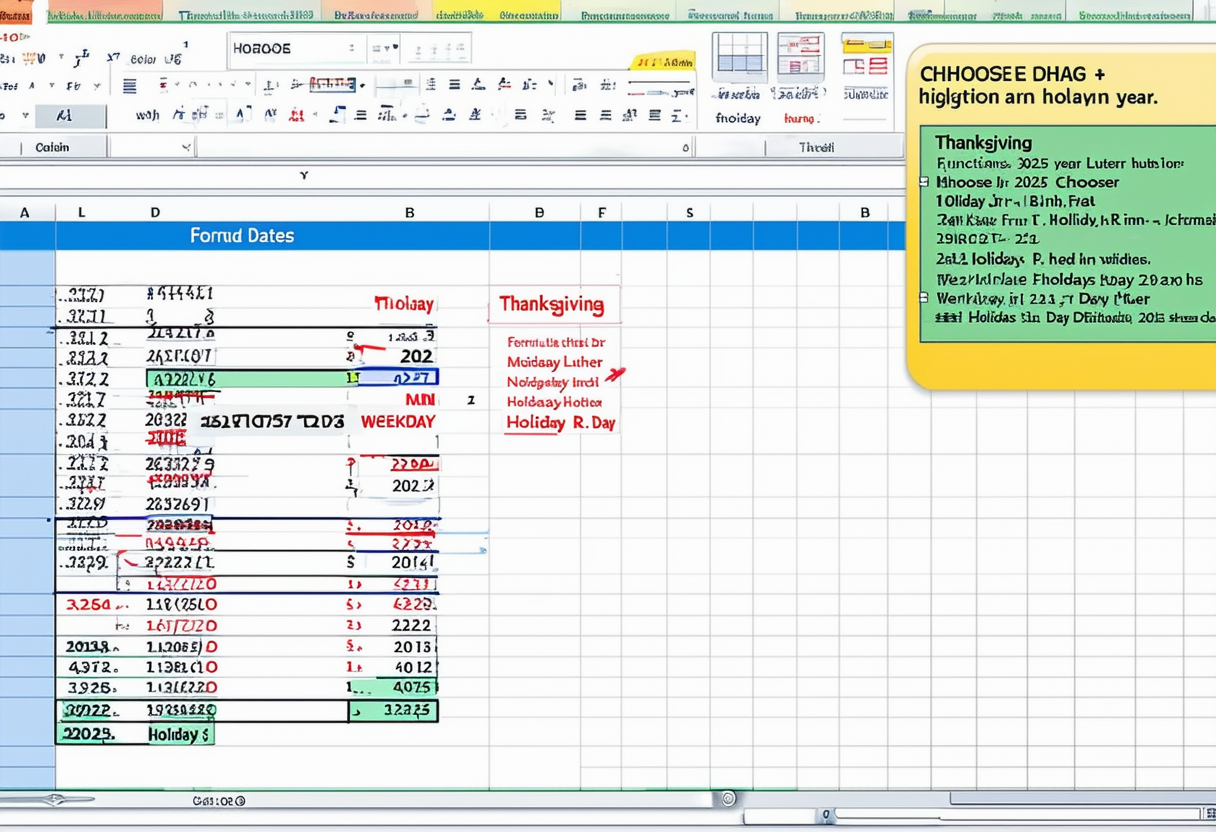
While Excel provides a variety of preset rules for conditional formatting, there may be times when these rules don’t meet your needs. In these cases, you can use formulas to create custom conditional formatting rules. Formulas allow you to define your own criteria for formatting cells, giving you more control over how your data is displayed.
Formulas in conditional formatting work by returning a TRUE or FALSE value for each cell in the selected range. If the formula returns TRUE, the cell is formatted according to the rule. If the formula returns FALSE, the cell is not formatted.
Basic Formulas
There are many different formulas you can use in conditional formatting, ranging from simple comparisons to complex calculations. One of the most basic types of formulas is a comparison formula, which compares the value of a cell to a specific value. For example, the formula “=A1>10” would format cells with values greater than 10.
Another basic type of formula is a text comparison formula, which compares the text in a cell to a specific string. For example, the formula “=A1=”Yes”” would format cells that contain the text “Yes”. These basic formulas can be incredibly useful for highlighting specific values or text in your data.
Advanced Formulas
While basic formulas can be incredibly useful, there may be times when you need to use more advanced formulas in your conditional formatting rules. These formulas can incorporate a variety of functions and operators, allowing you to create complex criteria for formatting your cells.
For example, you might use the AND function to create a rule that formats cells based on multiple criteria. The formula “=AND(A1>10, B1<5)” would format cells where the value in column A is greater than 10 and the value in column B is less than 5. This allows you to highlight specific combinations of values in your data.
Practical Applications of Conditional Formatting Formulas
Now that we’ve covered the basics of conditional formatting and its associated formulas, let’s look at some practical applications. Whether you’re analyzing sales data, tracking project progress, or managing a budget, conditional formatting can help you visualize and understand your data.
One common use of conditional formatting is to highlight outliers in your data. For example, you might use a formula to highlight sales that are significantly above or below average. This can help you identify trends and anomalies that might otherwise go unnoticed.
Highlighting High and Low Values
One of the most common uses of conditional formatting is to highlight high and low values in a dataset. This can be done using a simple comparison formula. For example, the formula “=A1>100” would highlight cells with values greater than 100, while the formula “=A1<50” would highlight cells with values less than 50.
This can be incredibly useful when analyzing financial data, as it allows you to quickly identify high and low performing areas. For example, you might use this technique to highlight high and low sales regions, or to identify high and low cost items in a budget.
Identifying Trends
Another practical application of conditional formatting is to identify trends in your data. This can be done using a variety of formulas, depending on the nature of your data and the specific trends you’re looking for.
For example, you might use a formula to highlight cells that show an increase or decrease over time. This can be done using the IF function, which allows you to create a rule that formats cells based on a condition. The formula “=IF(A2>A1, TRUE, FALSE)” would highlight cells that show an increase from the previous cell.
Common Challenges and Solutions
While conditional formatting can be incredibly powerful, it can also be challenging to use effectively. There are a number of common challenges that users face when working with conditional formatting, from understanding how formulas work to troubleshooting issues with formatting.
In this section, we’ll cover some of these common challenges and provide solutions to help you overcome them. Whether you’re struggling to understand how to use formulas in conditional formatting, or you’re having trouble getting your formatting to apply correctly, these solutions should help you get back on track.
Understanding Formulas
One of the most common challenges users face when working with conditional formatting is understanding how to use formulas. Formulas in conditional formatting can be complex, and it can be difficult to understand how they work if you’re not familiar with Excel’s formula syntax.
One solution to this challenge is to take the time to learn about Excel’s formula syntax and functions. There are many resources available online that can help you understand how to use formulas in Excel, from tutorials and guides to forums and communities. By taking the time to learn about formulas, you can improve your ability to use conditional formatting effectively.
Applying Formatting Correctly
Another common challenge users face when working with conditional formatting is applying the formatting correctly. It can be easy to make mistakes when applying conditional formatting, such as selecting the wrong cells or using the wrong formula.
One solution to this challenge is to double-check your work. Before you apply your formatting, take a moment to review your selected cells and your formula. Make sure that your cells are selected correctly, and that your formula is written correctly. By taking the time to double-check your work, you can avoid common mistakes and ensure that your formatting is applied correctly.
Conclusion
Conditional formatting is a powerful tool in Excel that can help you visualize and understand your data. By using formulas in your conditional formatting rules, you can create custom criteria that allow you to highlight specific data points, identify trends, and make your spreadsheets more visually appealing and understandable.
While conditional formatting can be challenging to use effectively, with a bit of practice and understanding, it can become a valuable tool in your Excel toolkit. Whether you’re a beginner just starting out with Excel or an experienced user looking to expand your knowledge, understanding conditional formatting and its associated formulas can significantly improve your efficiency and effectiveness when working with Excel.


